Downloading your impact data as a chart (PNG) or a CSV file offers powerful advantages for further analysis, sharing, and presentation. Whether you need to present data to stakeholders or conduct a deeper analysis, exporting your data today
Benefits of Downloading Your Data
-
Enhanced Analysis: Exporting data as a CSV file allows you to perform advanced data analysis using tools like Excel or Google Sheets, helping you uncover trends and insights that are critical for decision-making.
-
Clear Visuals: A PNG file provides a clean, visual representation of your data, ideal for embedding directly into presentations or reports, making complex information easier to understand at a glance.
-
Effortless Sharing: Both CSV and PNG formats are easily shareable, ensuring that stakeholders receive the information they need in a format they can use immediately.
Steps to Download a CSV or PNG
-
Log In: Access the platform using your Super Administrator credentials.
-
Navigate to [susurate]: Find the option at the top of the home page or from the left-hand tab.
-
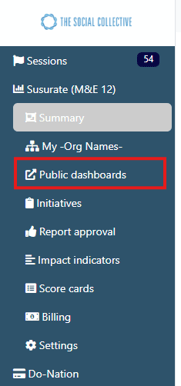
Select Public Dashboards: Either click on "Public Dashboards" or locate the specific chart you wish to export.
-
Open Your Chosen Dashboard: Once the desired dashboard is open, you can download or export the chart or its data.
-
Click the Hamburger Icon: Look for the three horizontal lines (hamburger icon) to access more options.
-
Choose Your Format: After clicking the icon, you will see options to download the chart as a PNG or export the data as a CSV.
Once you have opened your chosen dashboard, you are able to download or export the chart - or its data as a CSV by clicking the hamburger icon

Once clicked these options appear

Utilizing the Exported CSV or PNG
Once you have exported your data:
-
For PNG Files: The chart is ready to be embedded into your next team presentation or report. This visual can help convey key insights effectively.
-
For CSV Files: The data can be opened in spreadsheet software for further manipulation, analysis, or to create custom charts tailored to specific needs.
Example:
A PNG chart might look like this:

A CSV file will open in your spreadsheet software, where you can perform various calculations, create pivot tables, or apply filters to gain deeper insights.

By following these steps, you can ensure that your impact data is both actionable and presentation-ready, making it easier to communicate findings and drive informed decisions.